Tutorial miRCarta
General notes
Since miRCarta integrates miRBase and novel miRNA candidates, our views contain always miRBase or miRCarta in the header to
make it clear to which part the information refers. Also, internal links to miRBase or miRCarta content
are visualized using the same colors as for the headers (violet for miRBase, orange for miRCarta). We
will only change the miRBase part, if there is a new miRBase update. Otherwise, we added expression data
for human and targets from miRTarBase, microT-CDS, and TargetScan that were not contained in the
original miRBase database. The content of the miRCarta part will be updated with additional predictions,
organisms and features as miRNA isoforms etc in the future.
The following panels highlight and explain some features of our database.
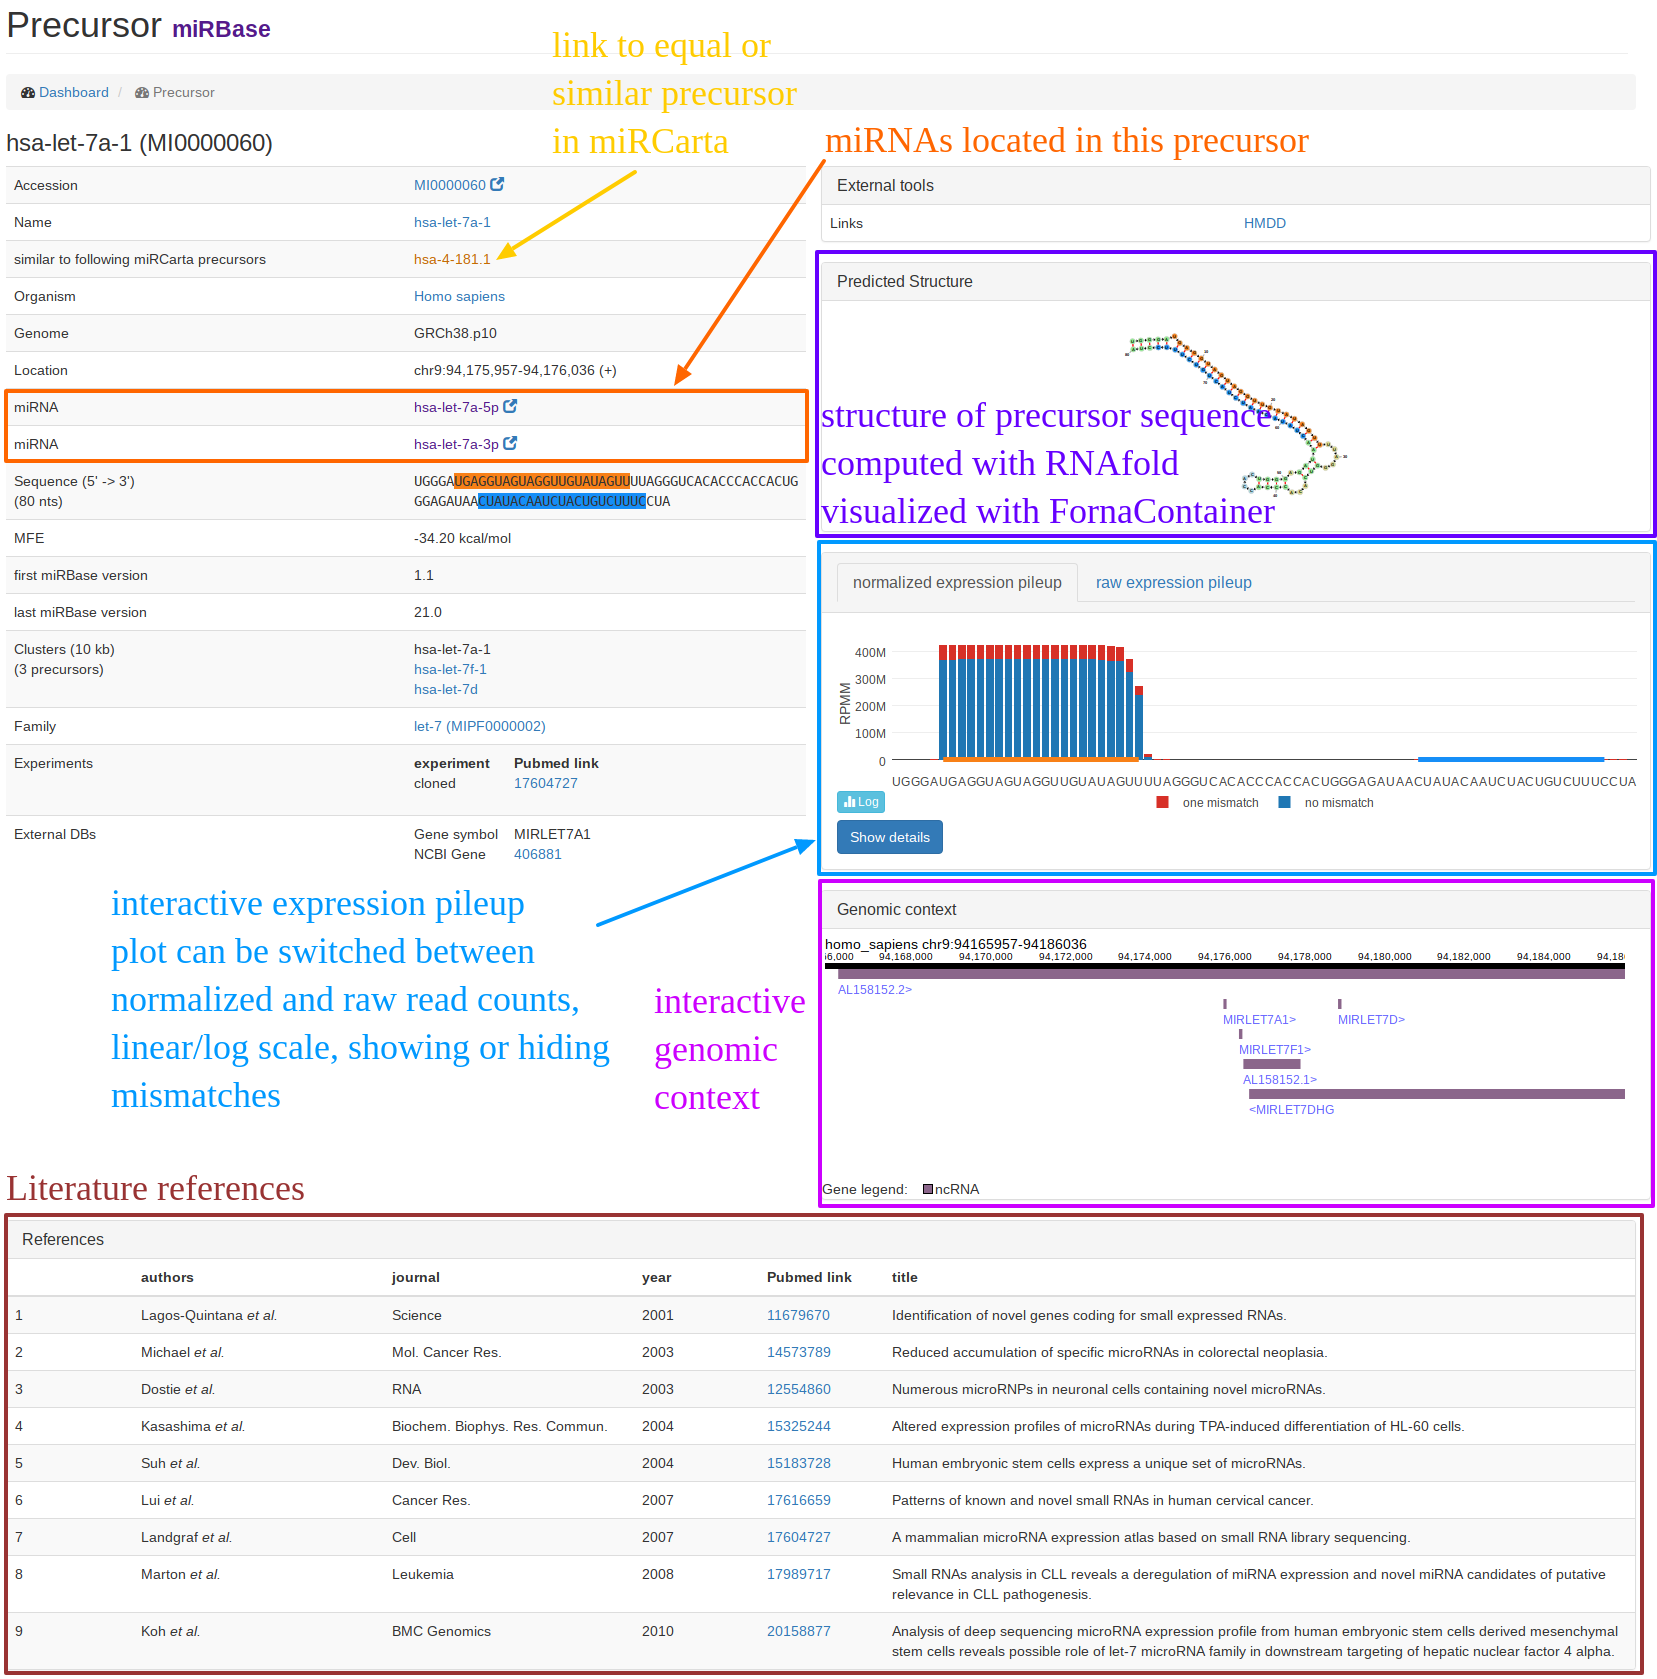
| The "precursor view" is shown when you searched for a precursor or followed a link of a precursor entry. In the example screenshot, the miRBase precursor hsa-let-7a-1 is shown. On the left hand side, we collect general information about the precursor like its sequence, location(s), miRNAs, similar entries in miRCarta etc. On the right-hand side, we link to external resources or provide some interactive plots, like the computed structure, the pileup plots, and the genomic context if available. The genomic context is freely zoomable and provides additional information when clicking on a gene or miRNA. At the bottom of the page, you can find literature references and links to Pubmed for the precursor if available. |
|
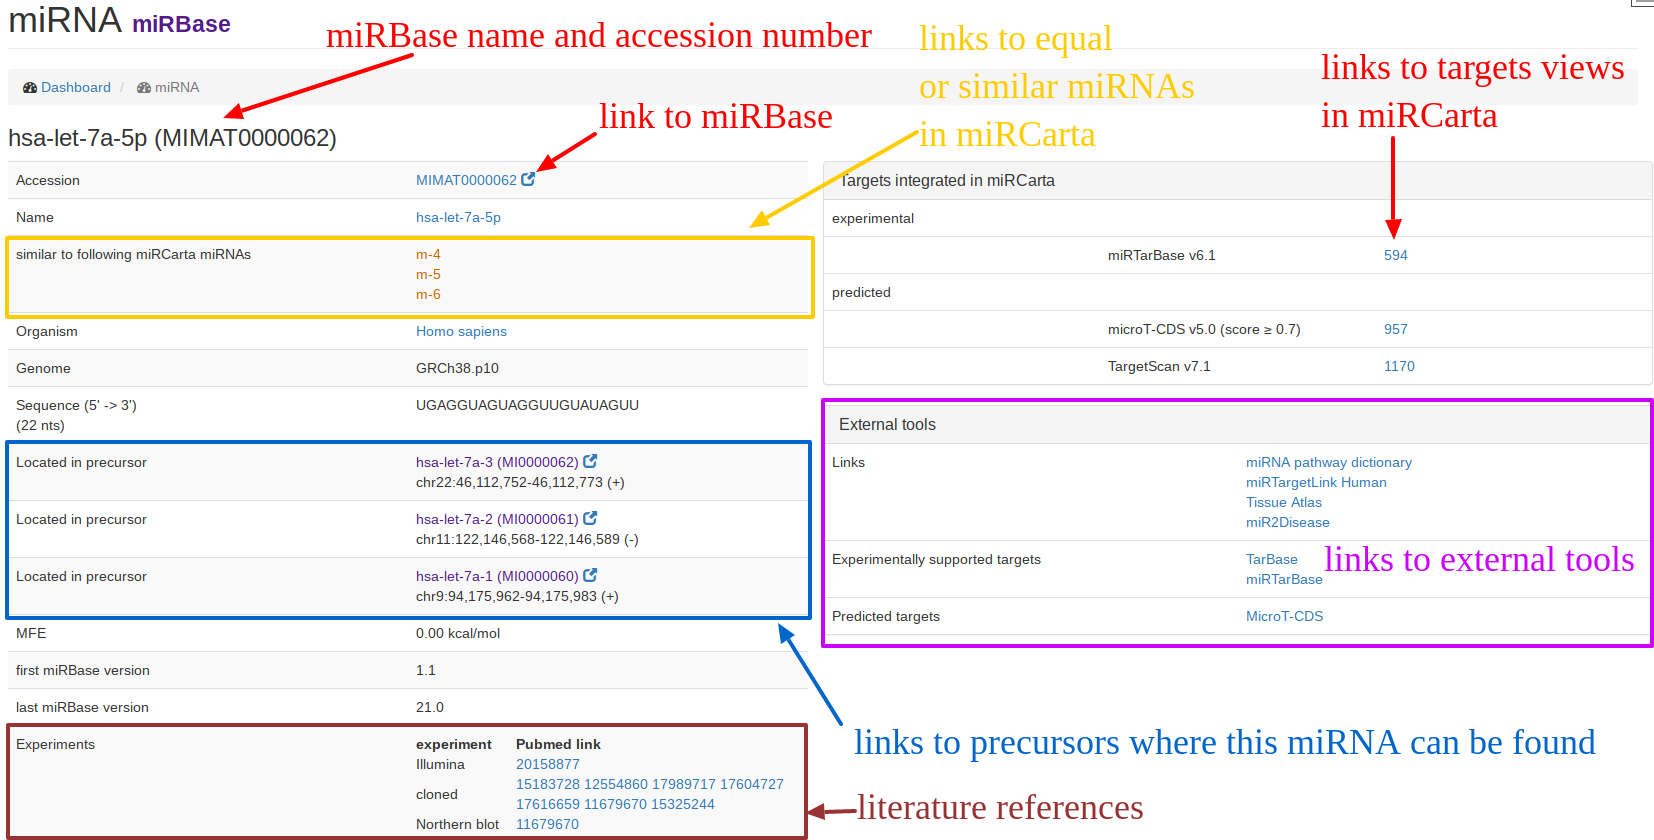
| The "miRNA view" for miRBase entries is exemplified for hsa-let-7a-5p. An original miRBase miRNA can have sometimes several "similar" miRNAs in miRCarta. Since we also consider 5' and 3' flanks around the miRNA sequence, we have now for hsa-let-7a-5p three entries m-4, m-5, m-6 in miRCarta that have the same core sequence but differentiate in flanks. On the right hand side, we provide links to the integrated target databases if available, as well as to external tools. |
|
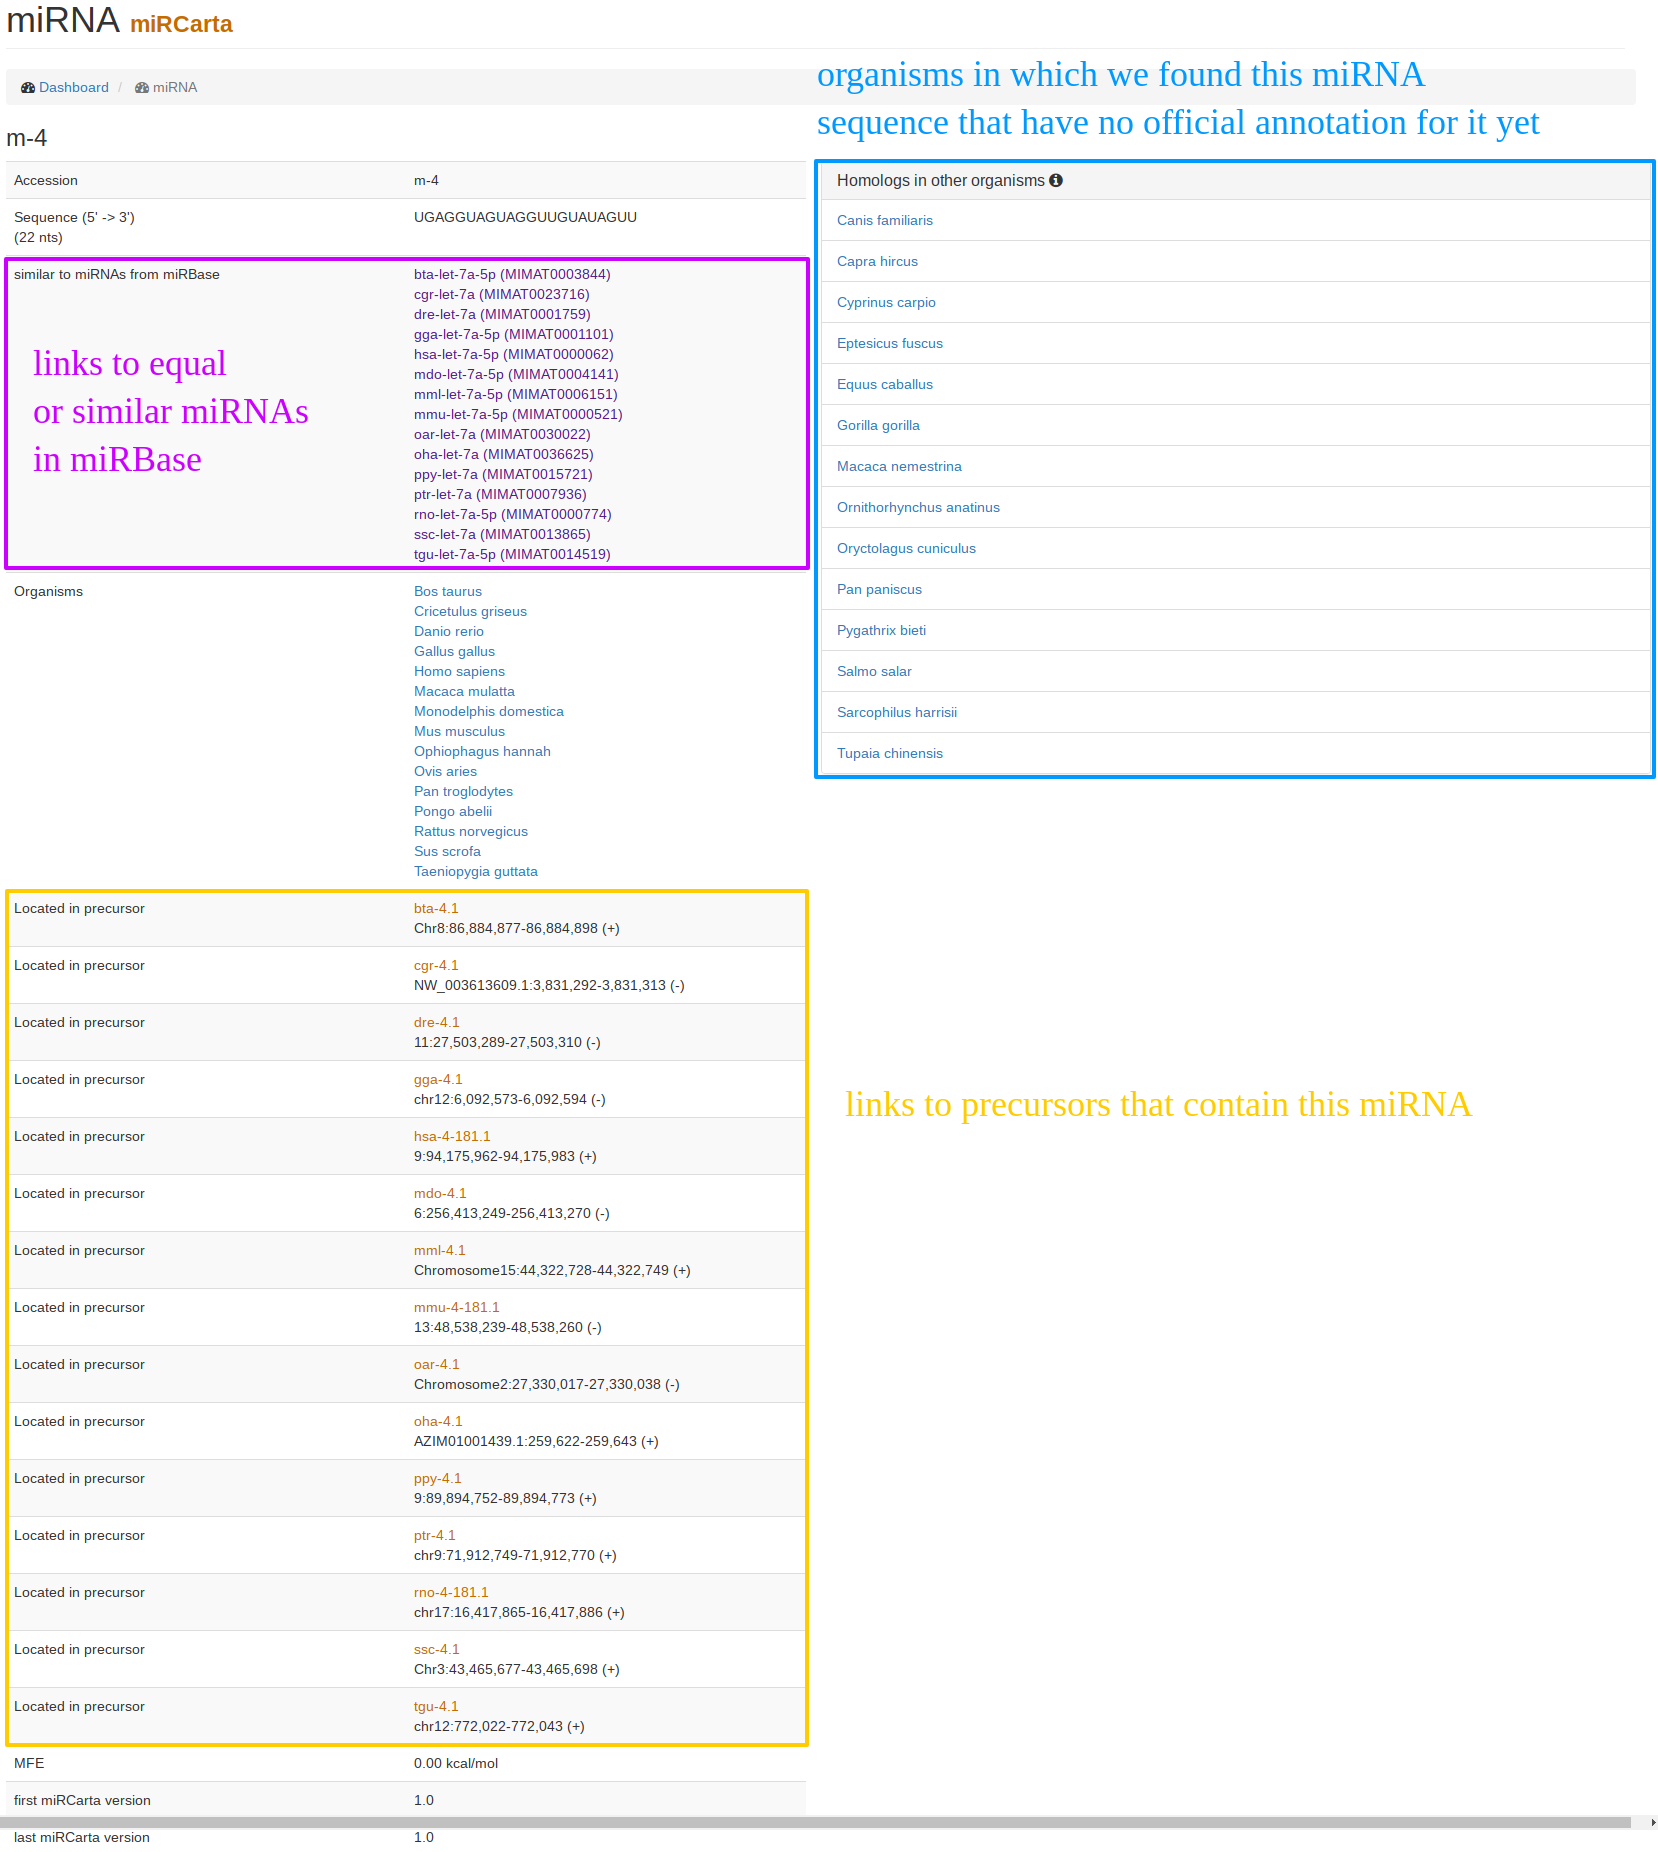
| The "miRNA view" for miRCarta entries looks a bit different than for the miRBase entries. This is because miRNAs in miRCarta are thought to be organism unspecific. On the example of m-4, it can be seen that this entry has locations in a bunch of precursors in different organisms, as well as links to many original miRBase miRNAs. On the right hand side, we list homologies in other organisms that were found by mapping the miRNA sequence with its flanks without mismatches to the genomes of the organisms integrated in miRCarta. |
|
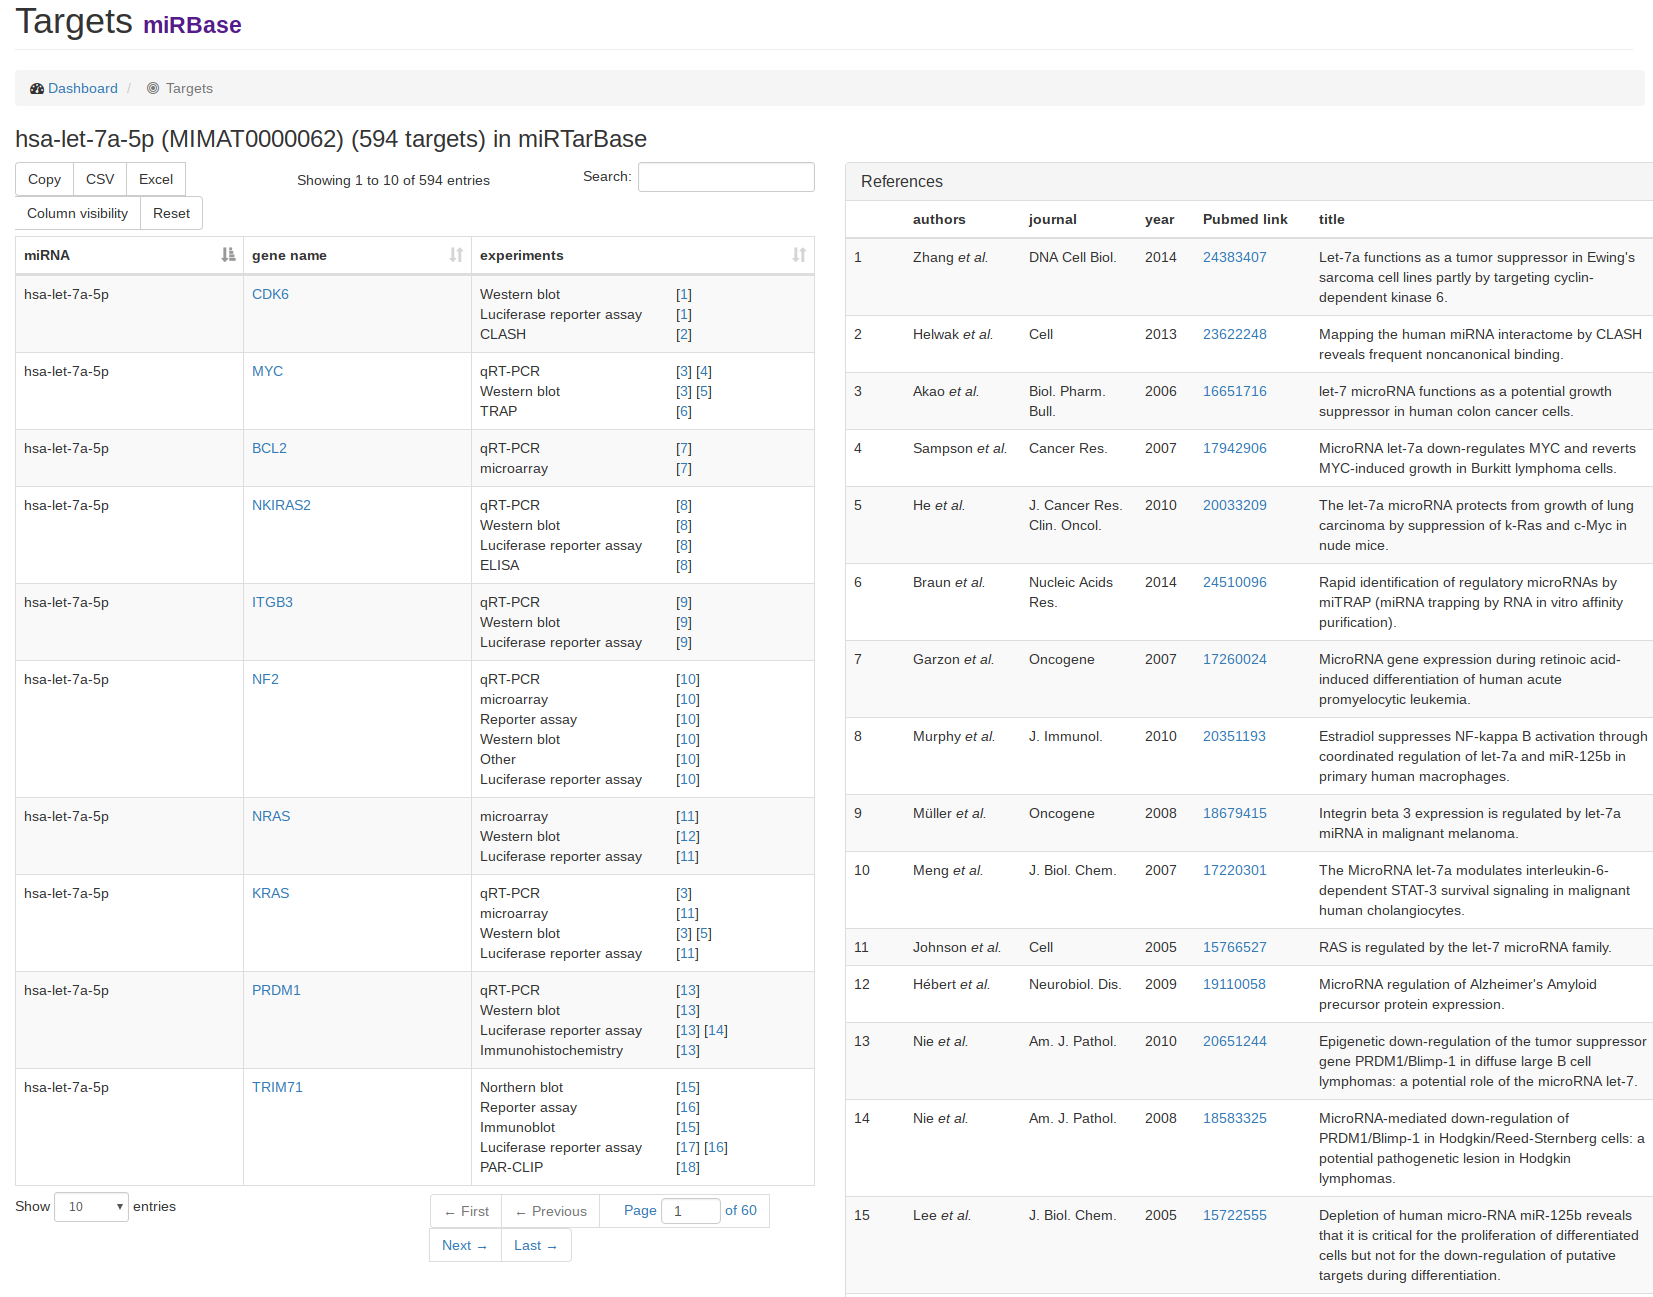
| As an example for a target view, we clicked on the link for miRTarBase in the miRNA view of hsa-let-7a-5p. On the left hand side, the target gene names for the miRNA are listed along with either the validation experiments for miRTarBase or prediction scores and target sites for the prediction databases microT-CDS and TargetScan. If miRTarBase was chosen, the references for the experiments are listed on the right hand side. |
|
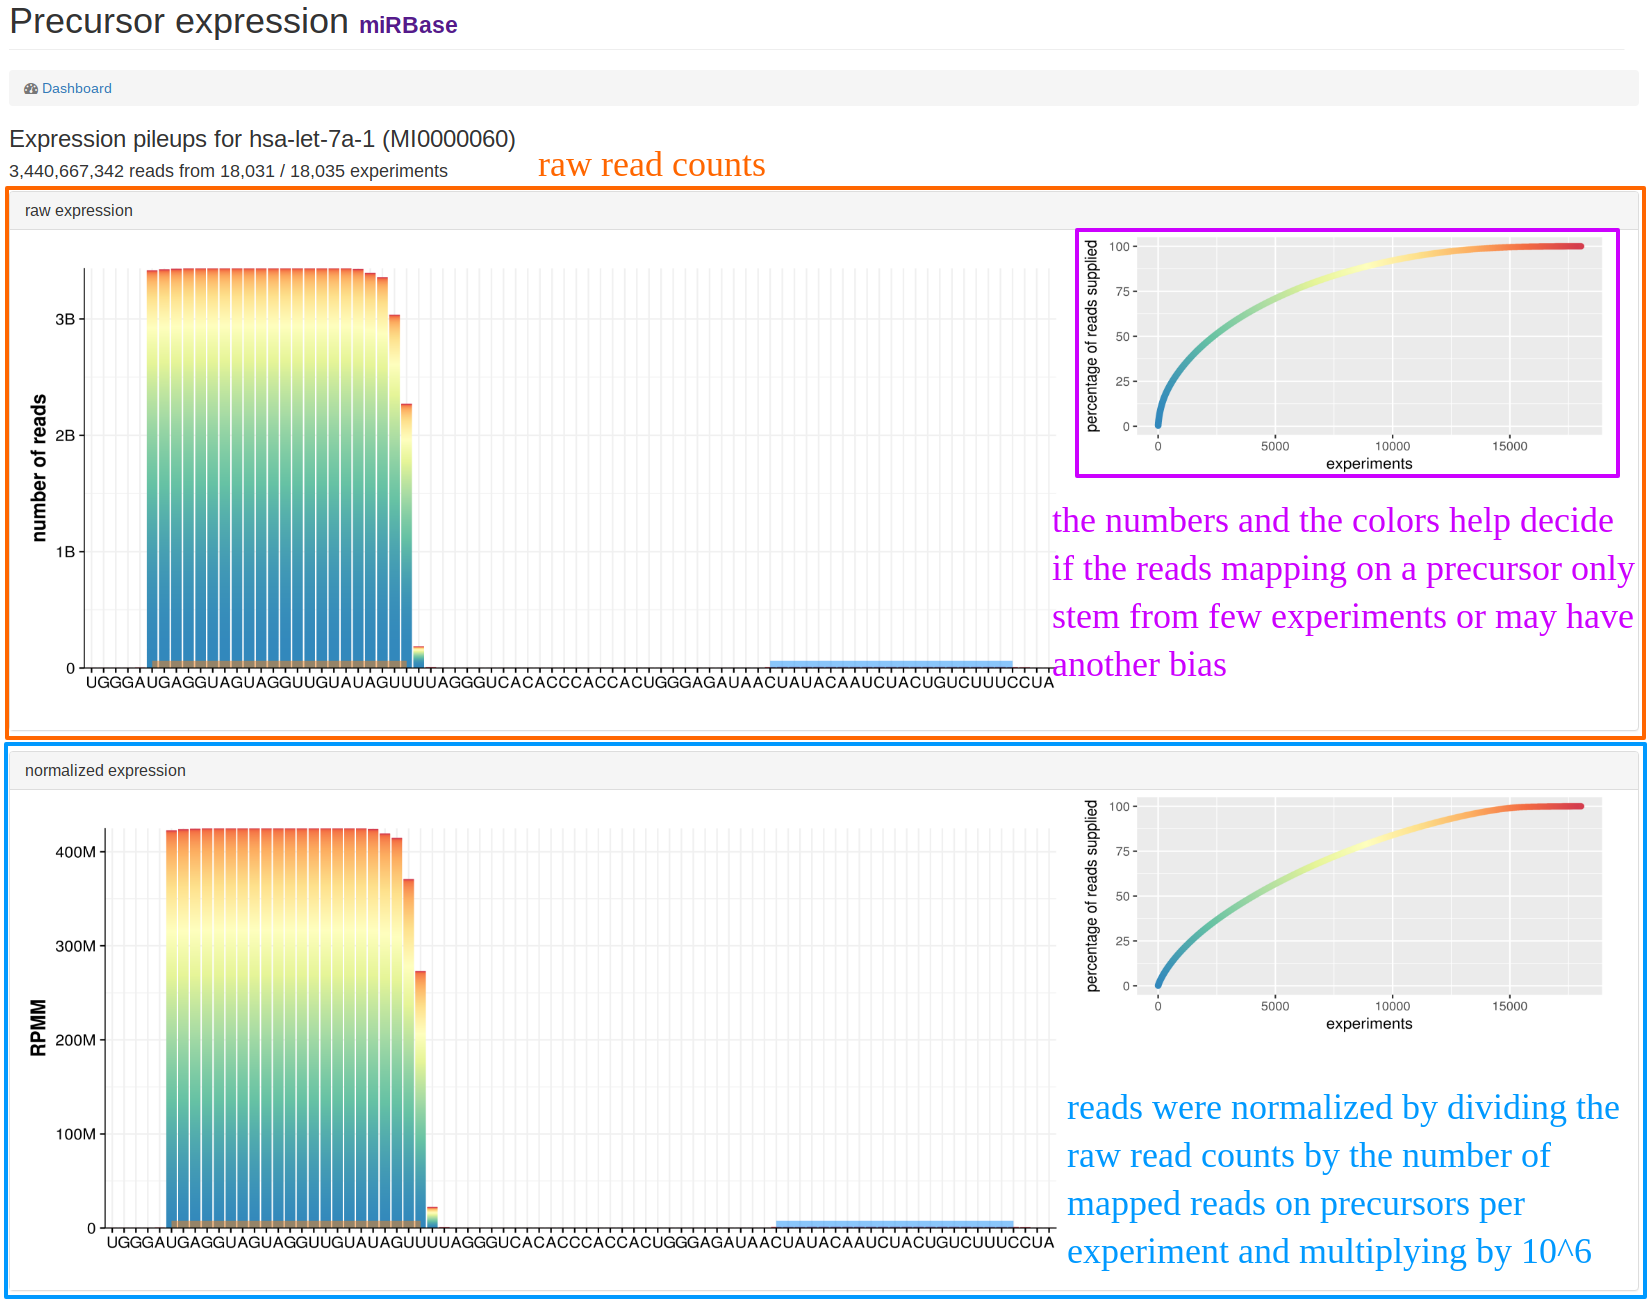
| This view can be found when clicking on "Show details" below the pileup plots in the "precursor view". The example shows additional information for hsa-let-7a-1. The upper part of the page shows the raw expression counts for all experiments where we had counts, the lower part shows the normalized reads. The legend on the right side exemplifies how many experiments added read counts for this precursor. This way, a potential bias can be easily identified if only few experiments provided read counts for the precursor. |
|
|
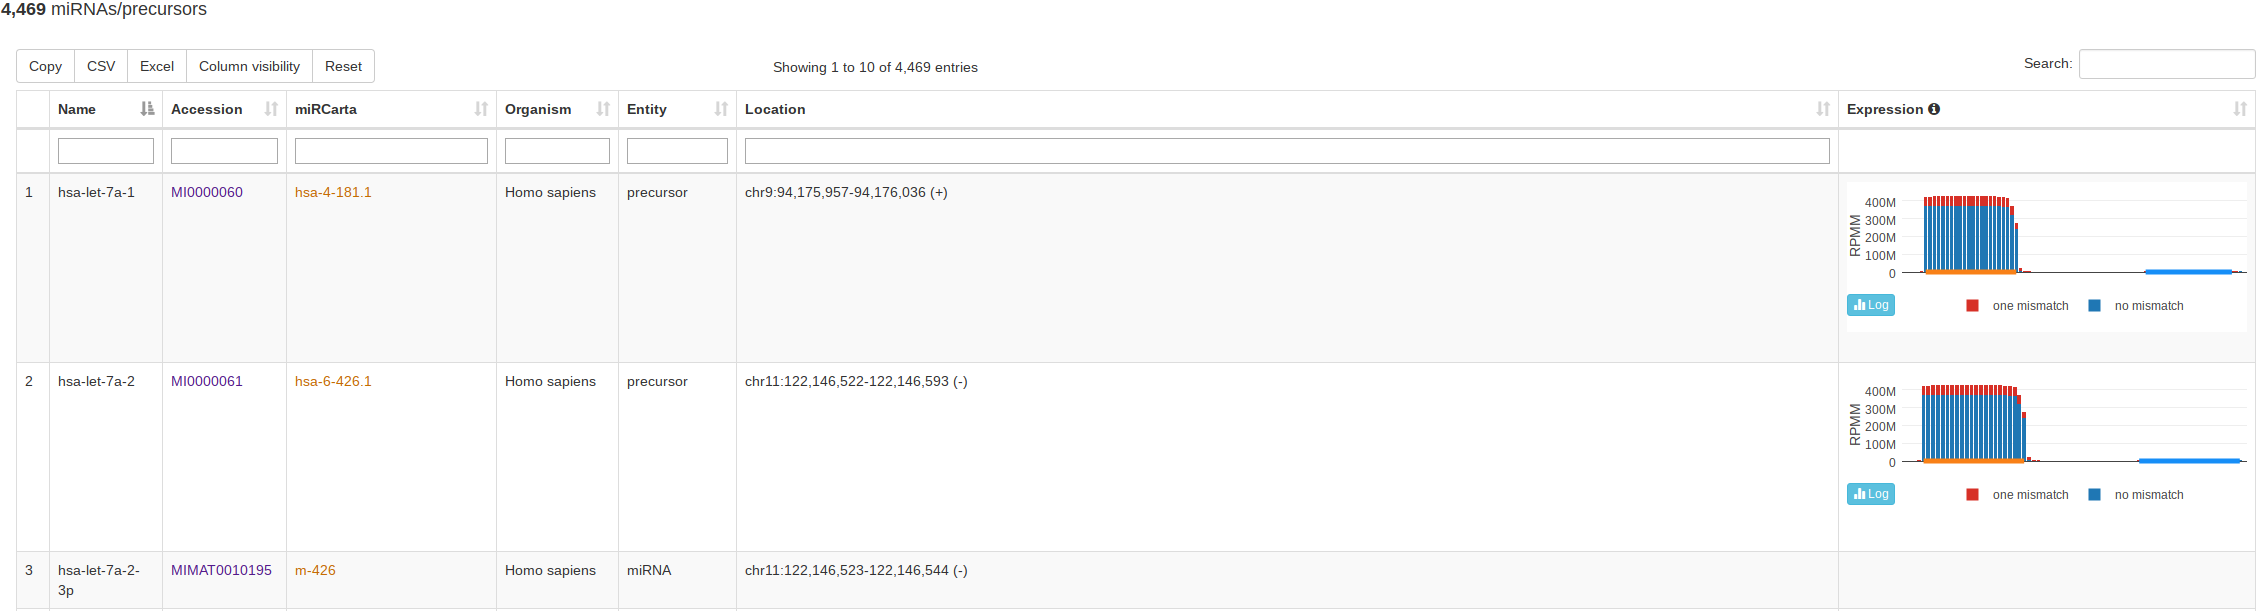
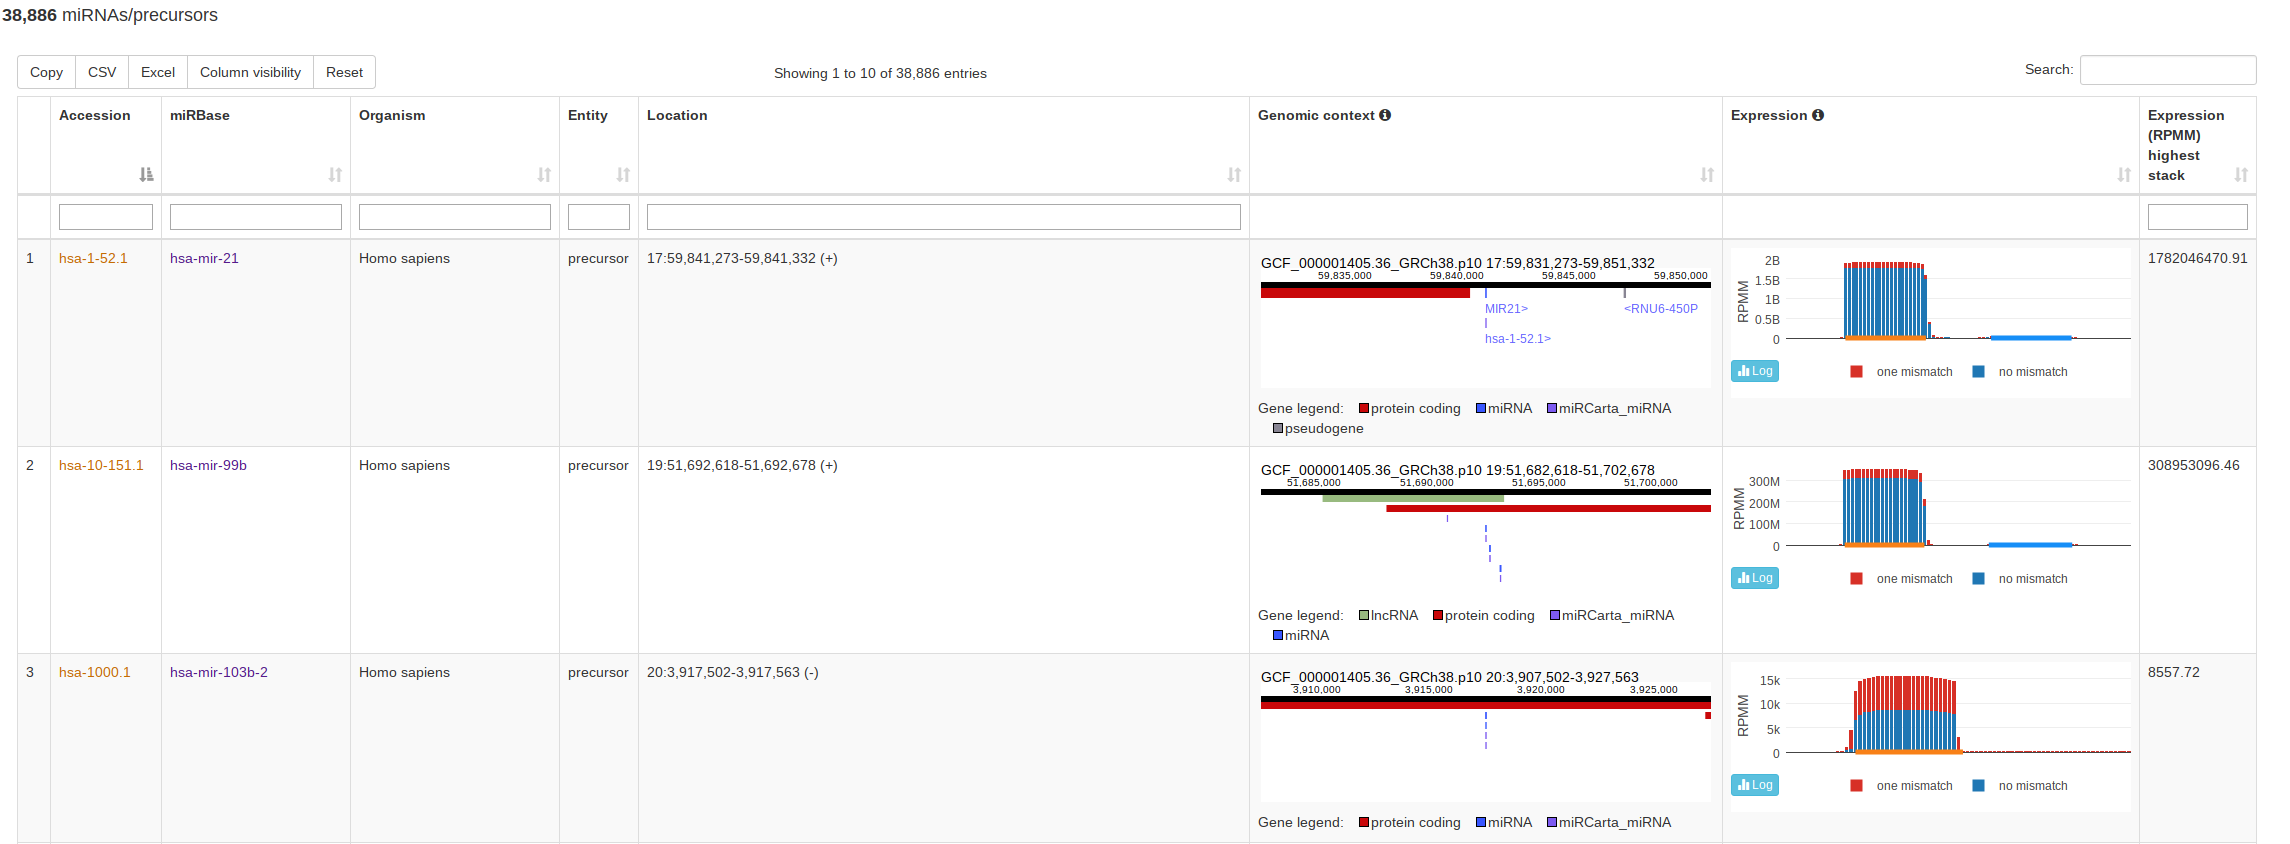
The classical entry point “Browse” lists all miRNAs and precursors for a selected organism. For precursors, this view also visualizes the normalized read counts of the mapped NGS data without and with mismatches if expression data is available. This way a user can assess if the expression profile over a (putative or known) precursor seems likely for miRNA expression and more rapidly identify real precursors/miRNAs from false positive annotations. The view for miRBase and miRCarta are slightly different. For miRCarta precursors, we also visualize the genomic context interactively. This is not done for miRBase entries, because sometimes a precursor has several locations there. Also, the genomic context visualization is not available for all miRBase organisms, because the coordinates rely partialy on outdated genomes. |
|
|
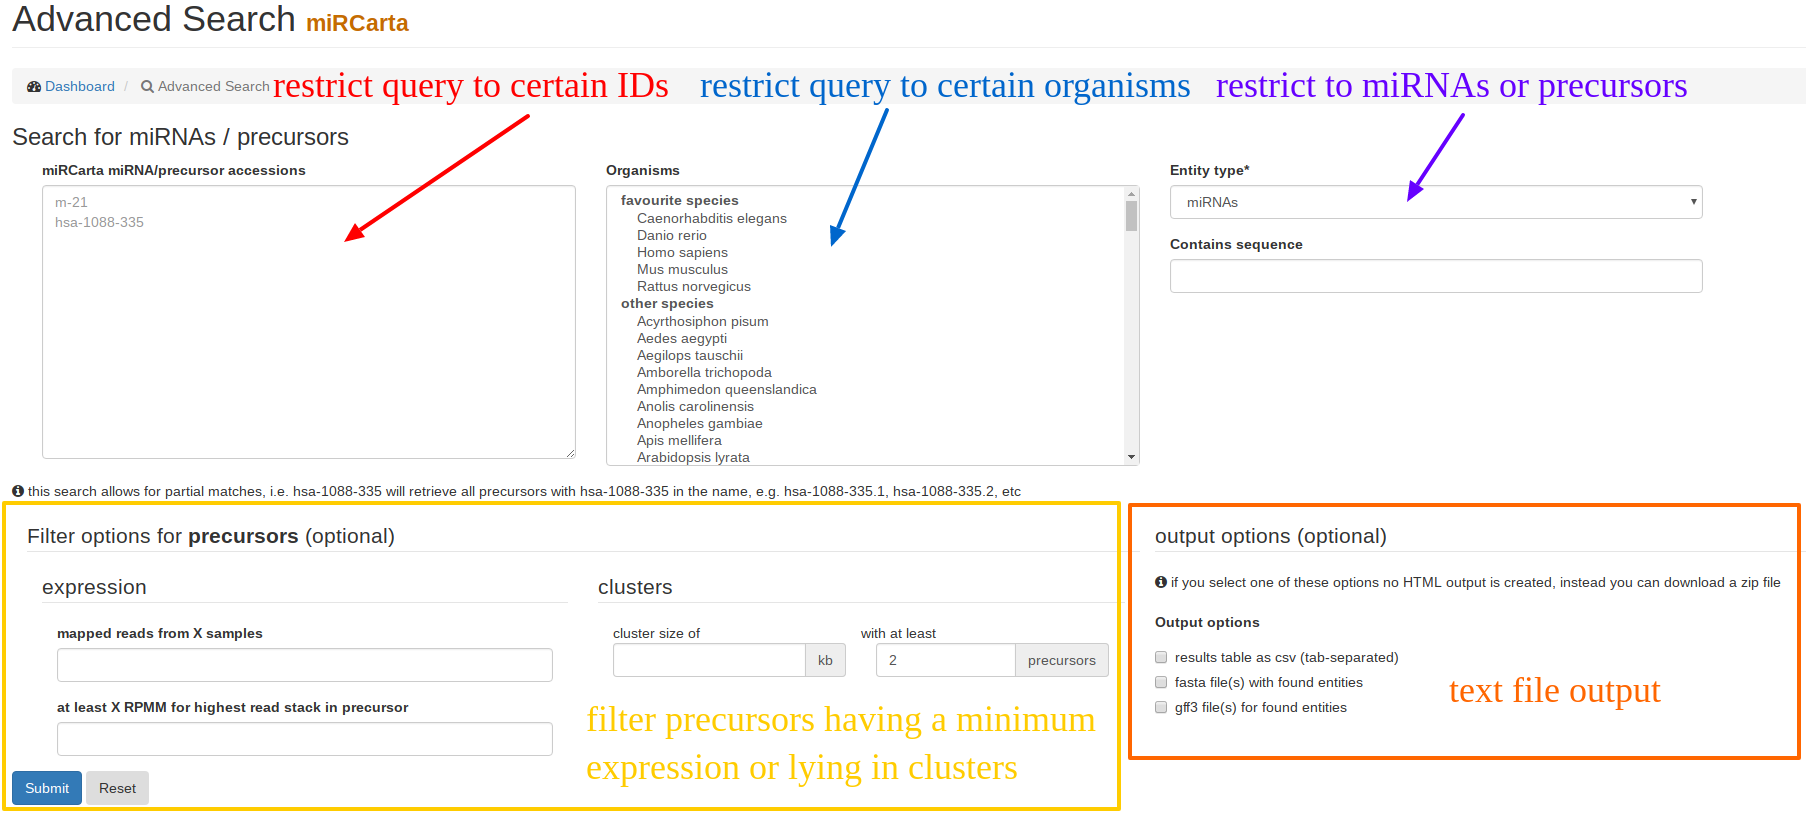
Using “Advanced Search”, users can restrict their query results to certain miRNAs and/or precursors of certain organisms that might have been validated with a certain experiment and so on. The results are visualized as HTML table, unless one of the download options are checked. |
|
|
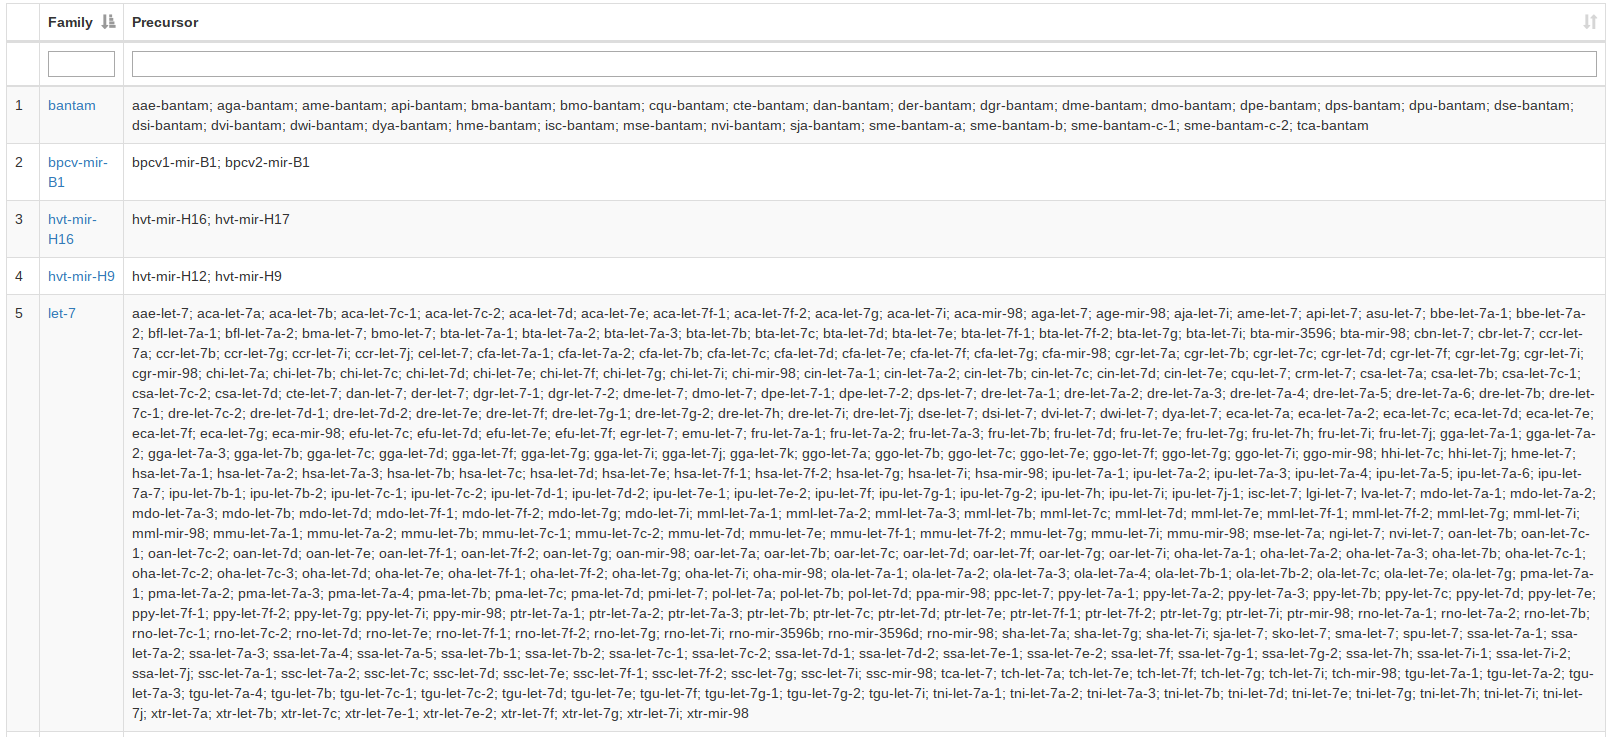
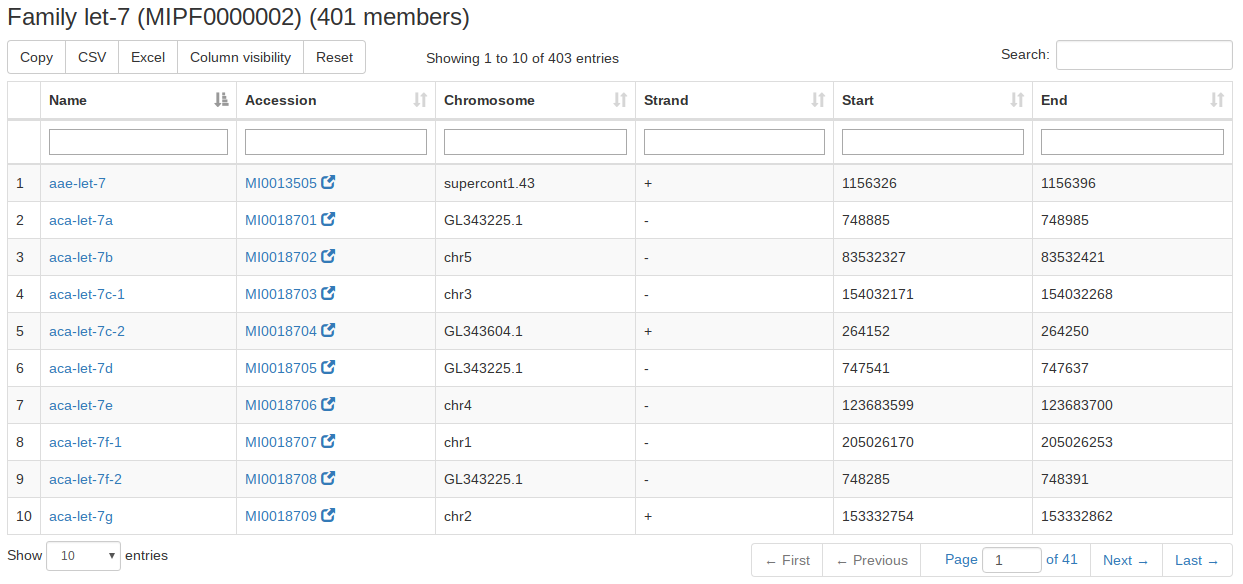
For the miRBase content we also integrated the precursor families. A user can search for precursor names or miRBase accession numbers or select an organism and gets as result all precursor families of the input. If nothing is selected all precursor families will be listed. |
|
|
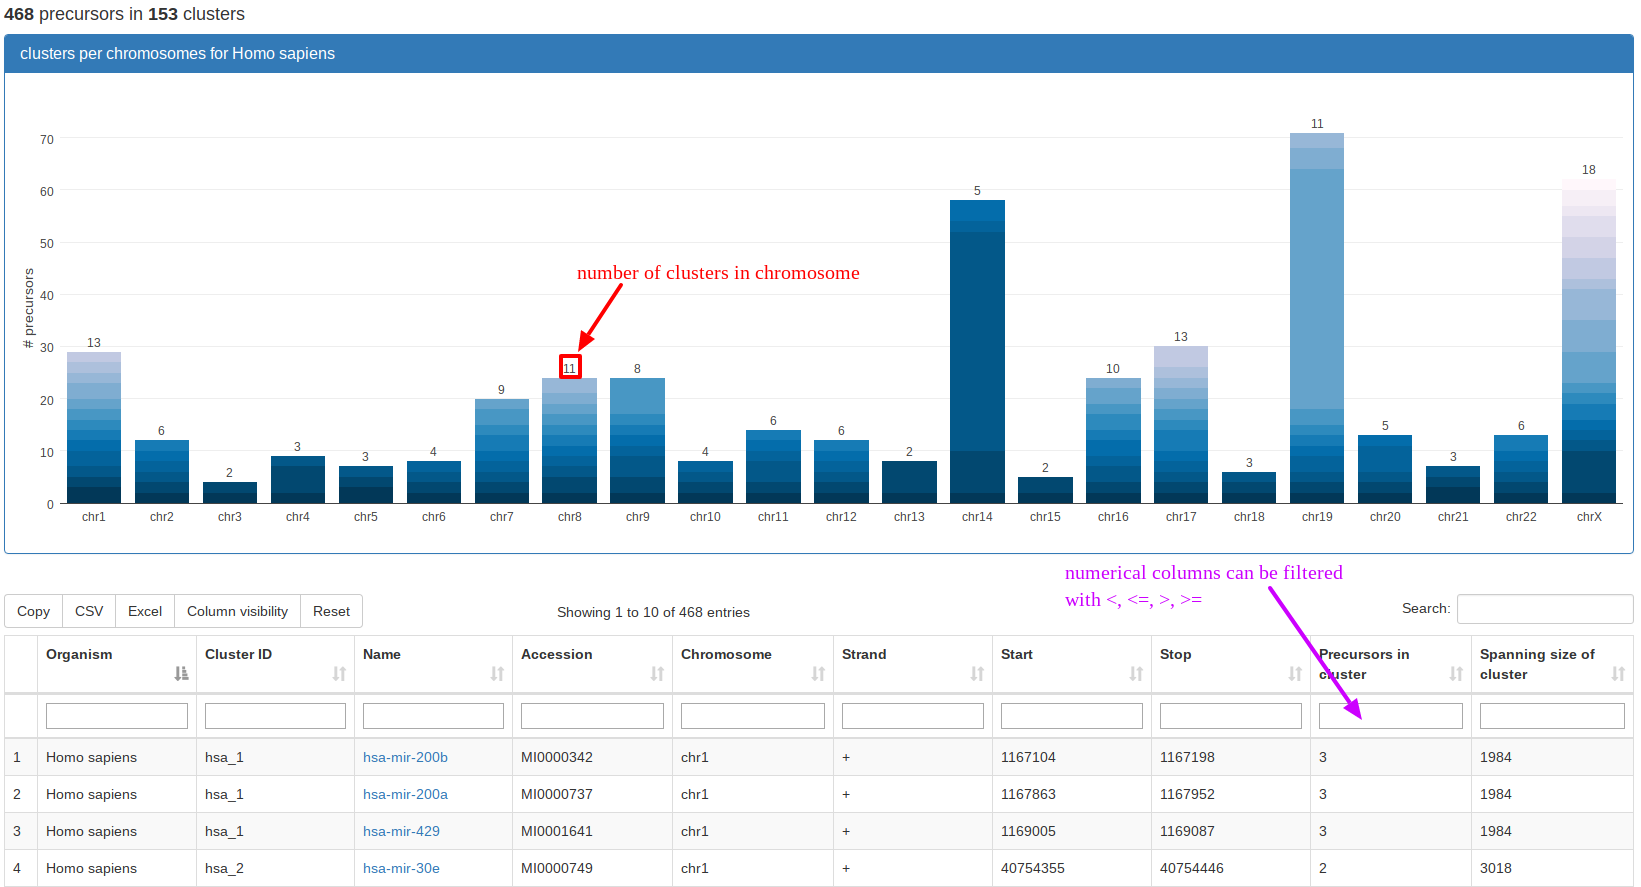
“Genomic Clusters” visualizes clusters of precursors within a selectable window in a tabular format and as stacked bar plots along the chromosomes. In the example, we queried the miRBase part for clusters in Homo sapiens. The stacked bar plot visualization directly shows that the largest contiguous clusters can be found on chromosomes 14 and 19, respectively. The screenshot also mentions that the table is filterable by using "<","<=", ">", ">=". In general, all our tables that have additional filtering boxes supply partial case-sensitive string matching and numerical filtering for numerical columns using the above operators before a number in the field. |
|
|
Inspired by the tool miRBase Tracker, we provide tracking information for each identifier in miRBase, which allows in a straightforward way to illustrate the changes a miRBase name or sequence underwent during different miRBase releases. |
|
|
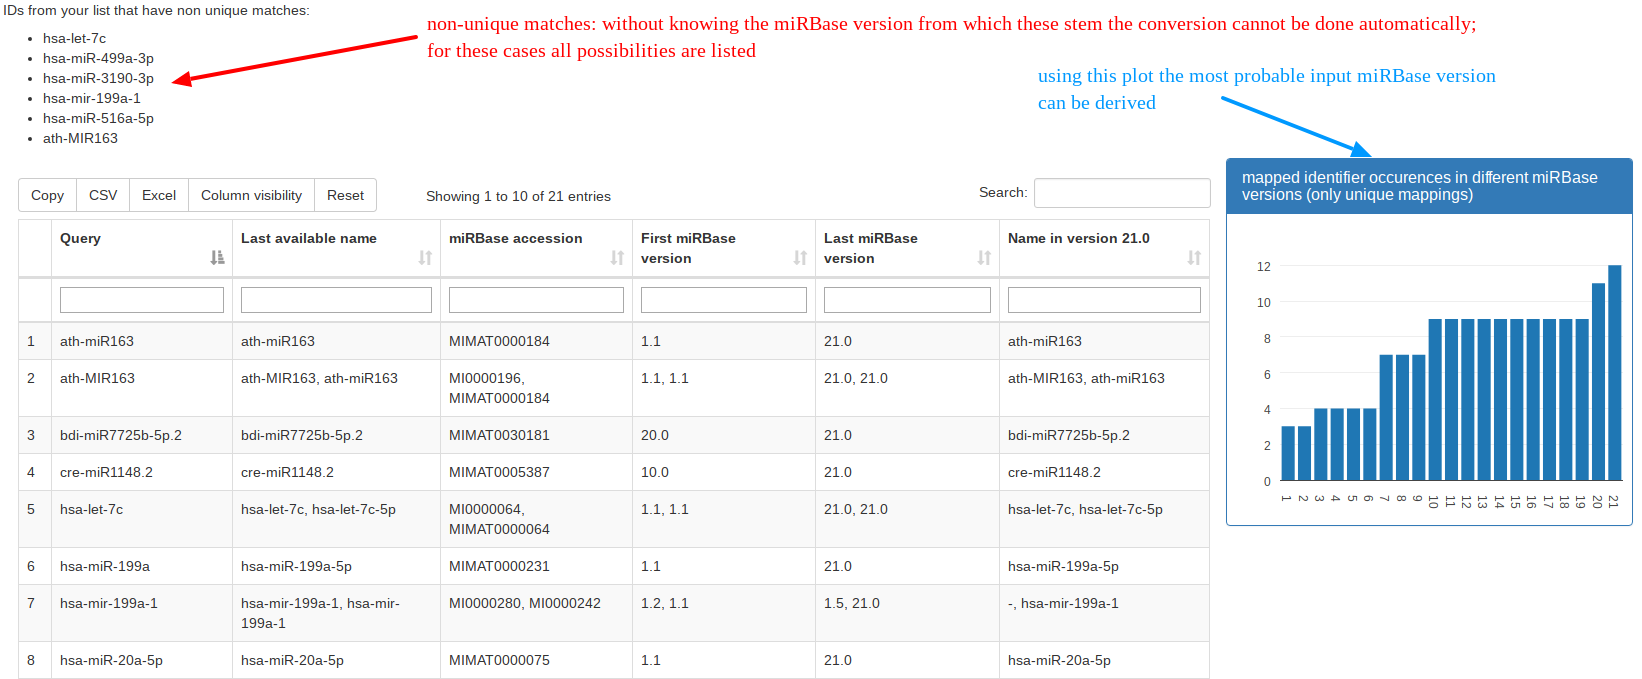
The naming of miRNAs changed during different releases of miRBase, which can cause problems when wanting to compare findings to older manuscripts where a different miRBase release was used. With the “Identifier Conversion” tool researchers can convert their miRBase names into the latest available version. |
|
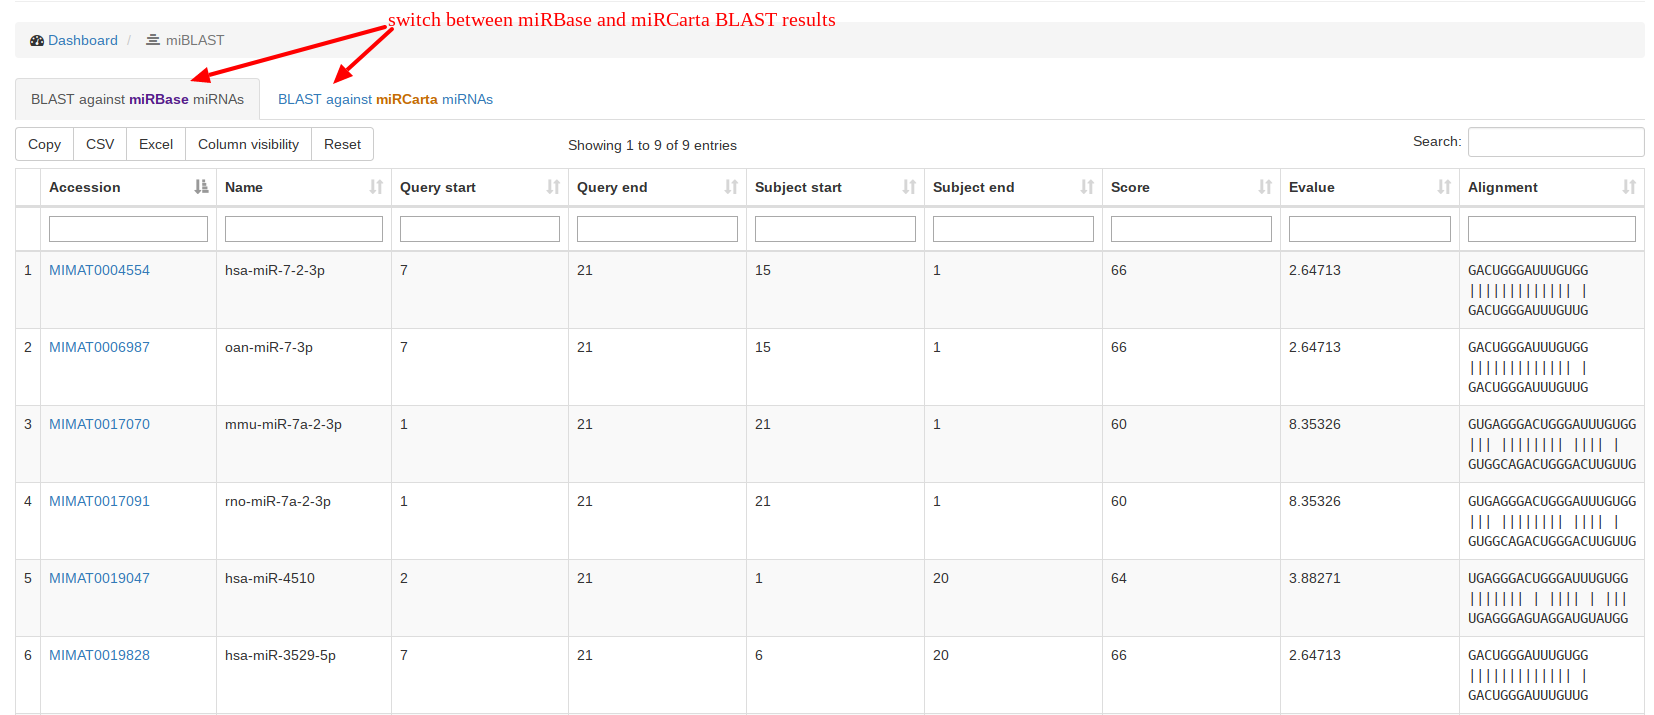
Under “miBLAST”, users can enter a miRNA sequence and get the BLAST
results for
miRBase and
miRCarta miRNAs. We use the command line tool blastn with the following parameters:
-task blastn-short -word_size 4 -num_alignments 100 -reward 5 -penalty -4 -gapopen 25 -gapextend 10This BLAST command is however not suitable for alignments against seed sequences. |
|
|
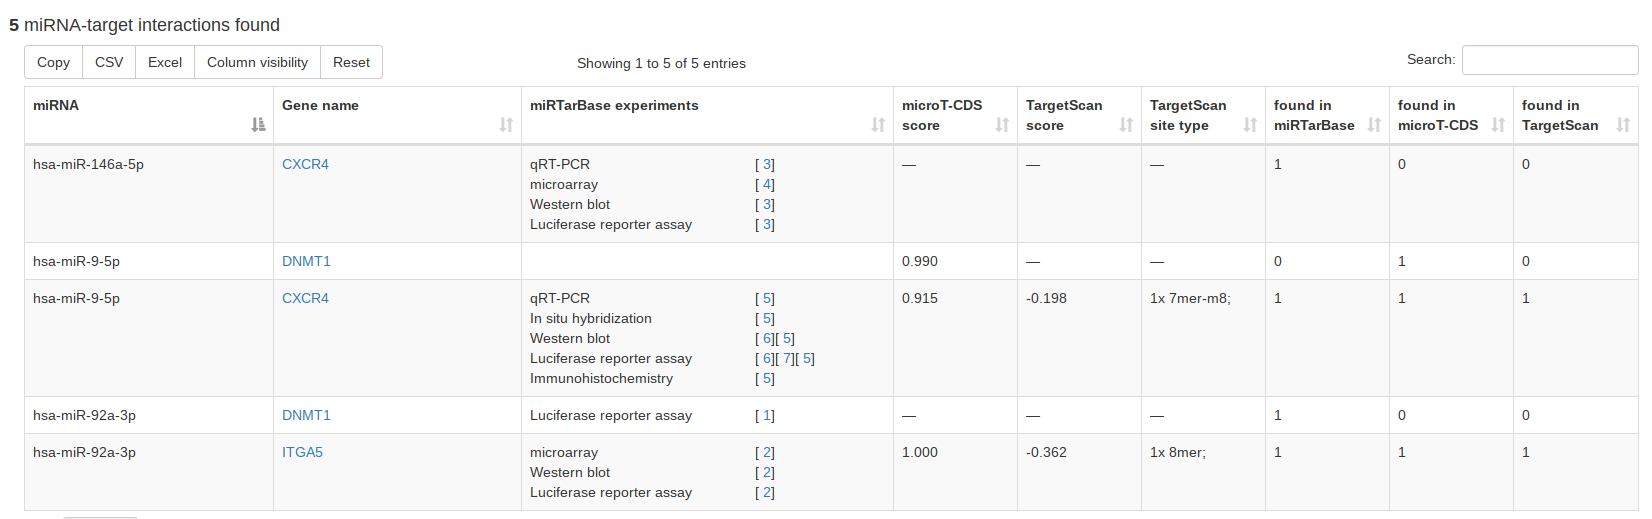
Since we integrated miRTarBase, microT-CDS and TargetScan, miRCarta can provide a combined search of miRNAs and targets using experimentally validated or predicted targets, respectively. If all three databases are selected, the resulting table will contain for each database a column with either 0 or 1 as entry, which can be used for sorting and filtering for results that have e.g. only hits in all three target databases. |
|
|
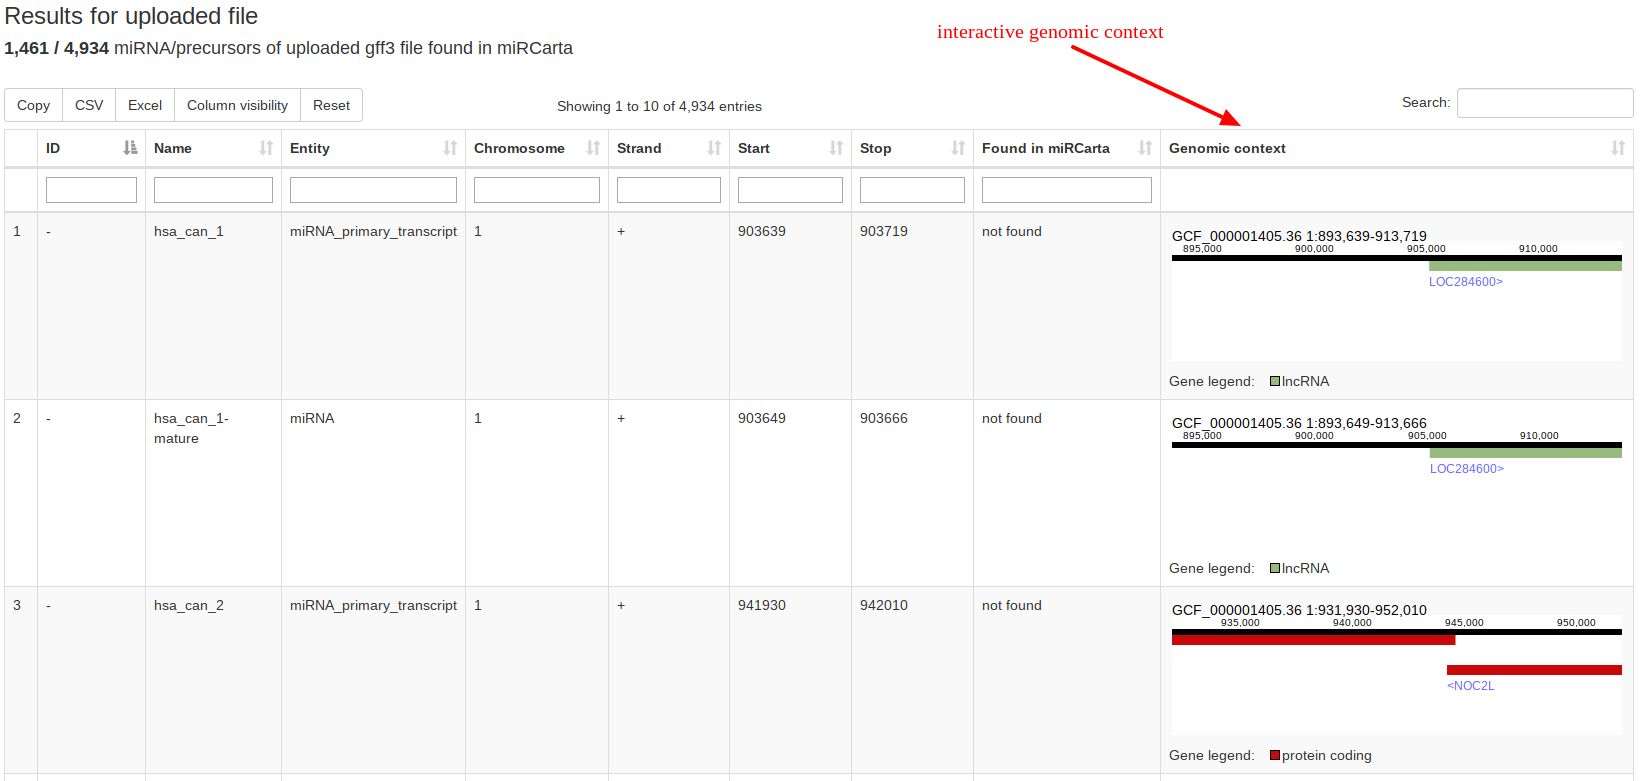
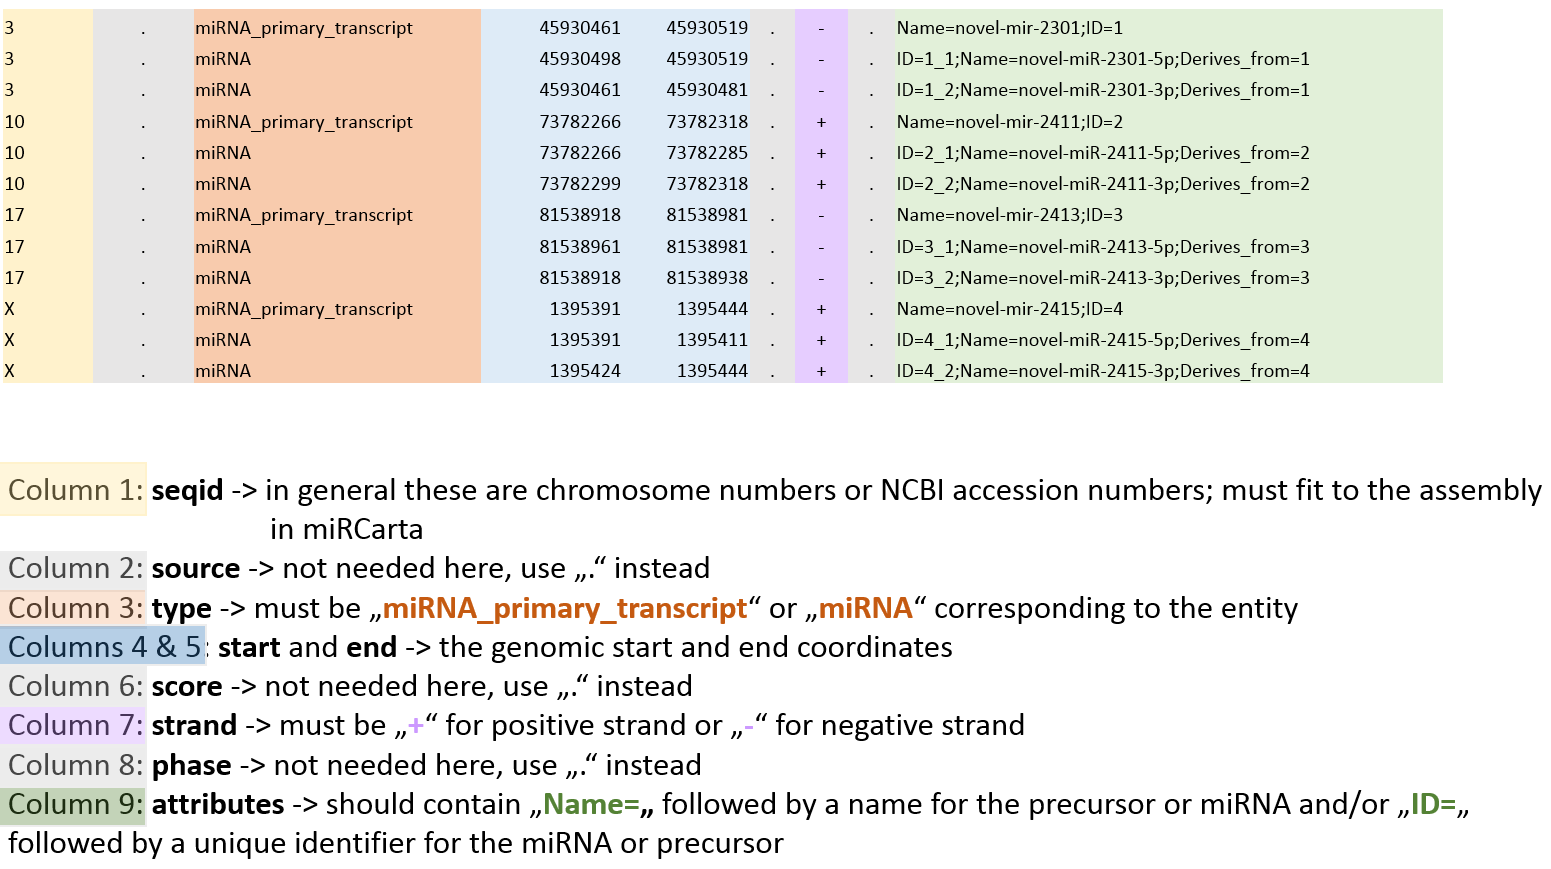
Using the analysis tool “GFF3 upload” users can upload their own standard GFF3 files containing e.g. the locations of predictions of miRNAs and precursors for a certain organism. The data is matched against the available miRCarta entries and the result is visualized as a table, where it is directly clear how many findings are new or have overlaps with entries in miRCarta. GFF3 files are tab-separated text-files generally used for sequence annotations. |
|
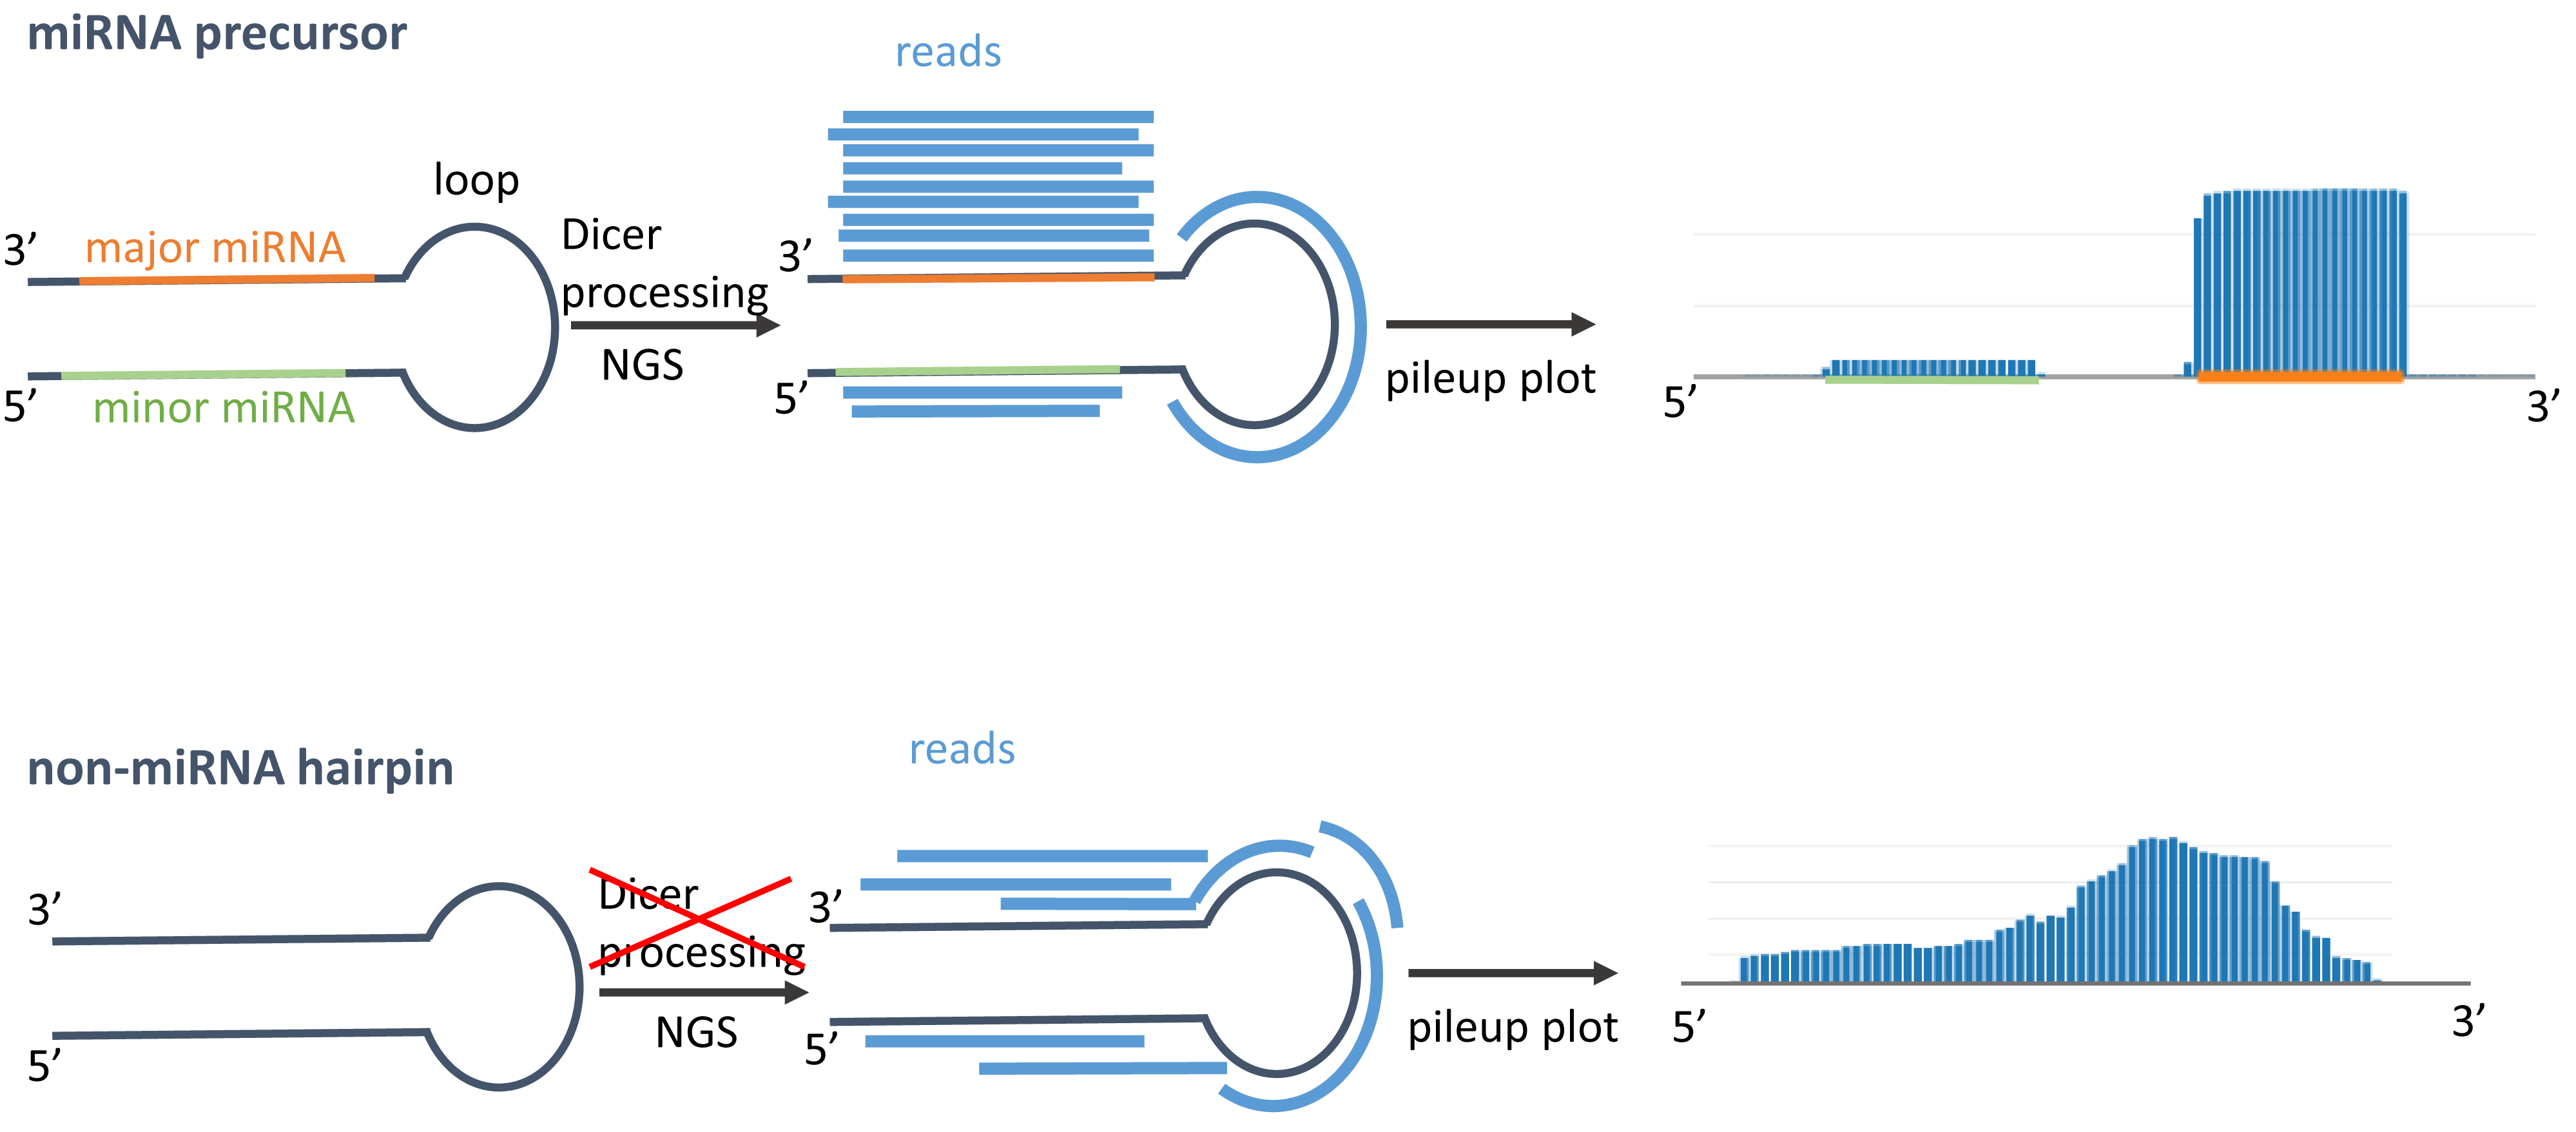
In general, miRNA precursors that follow the canonical Dicer processing pathway are cleaved into three parts: the major miRNA, minor miRNA, and loop. During the miRNA biogenesis, typically the loop and the minor form are degraded, while the major miRNA is loaded into Argonaute complex to perform its regulatory function. Using next-generation sequencing, the reads should also mirror this Dicer processing for miRNA precursors. In the figurative example on top of the right side, we see that the reads are more frequently covering the major form and only a few reads are mapped on the loop and minor miRNA. When visualizing the reads as pileup plot, we would expect to find at least one more or less discrete read stack for the major miRNA and a smaller one for the minor miRNA. In linear scale, we mostly only see the highest read stack of the major miRNA. If a miRNA has many isoforms, the ends of the miRNAs extend to a lesser frequency in 5' or 3' direction, which can e.g. be seen for hsa-miR-21-5p in 3' direction. If we have predictions that show an expression profile as in the second example on the right side, chances are high that either these do not follow the generic Dicer processing or are false positive hits, because the reads in the pileup do not show discrete read stacks and are more or less uniformly distributed along the sequence. |
 Adapted from Friedländer et al.
|